Understanding Government through Data Visualization
February 2020
How can we improve government through data visualization?
Global Game Jam 2017: Moon Mage
January 2017

The year is 20XX. Moon Rabbits lived peacefully in the moon until a spaceship landed in the moon. Outside the spaceship comes scientists who developed super strong steroids. The rabbits thought they were innocent but the buff dudes beat up their entire kingdom. These scientists seek to take control over the moon so that humans too can live in the moon. The rabbit king stole the spaceship and crash landed on the earth. A girl found the rabbit and in his last breath, he gave the girl powers to control the moon and save their kingdom. The only problem is that she can no longer swim. The buff scientists, notice that their moon is getting moved around, and now they went back to earth to kill the girl so that they have complete control of the moon.
Inspired by Maciej Ceglowski's talk, Deep-Fried Data, I converted my client rendered D3 visualizations to server renderings. Preprocessing the data visualizations on the server allows users without Javascript to see my wonderful bar charts and scatterplots.
Visualizing Travel Effort
September 2016
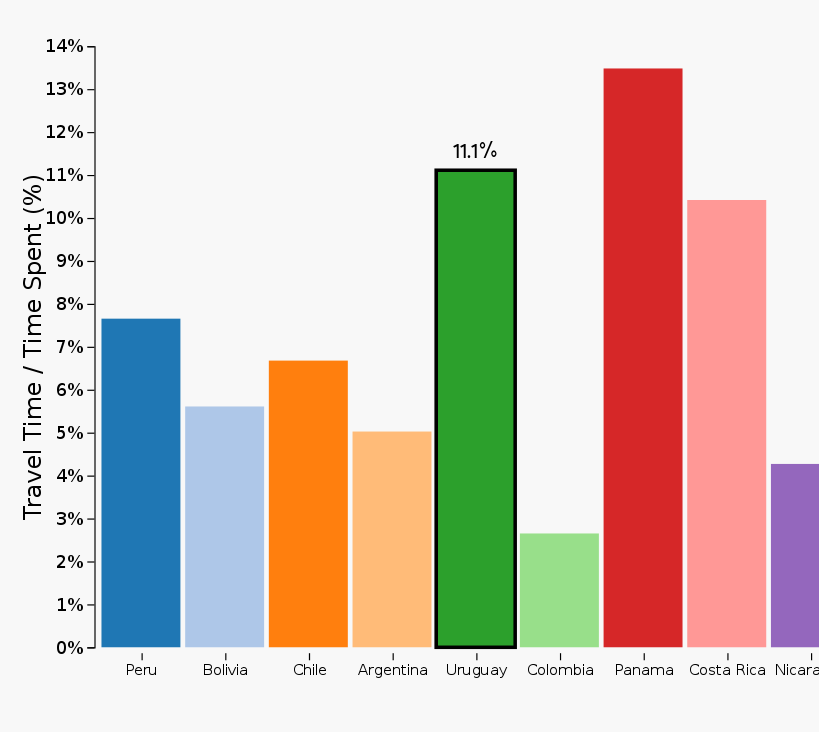
Some things make traveling hard: busses leave at early times, distances are large between places, traveling consumes a large portion of your day, stays at each place are short, and the stays themselves are not comfortable.
Visualizing our yearlong budget through Latin America
September 2016
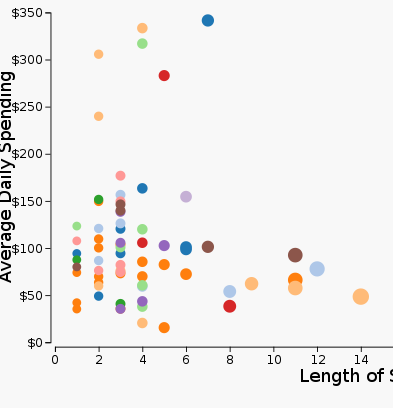
After working for two years post graduating, my girlfriend and I quit our jobs and bought one way tickets to Lima, Peru. We made our way around South America and up Central America back to California. Managing our budget was an everyday activity, and it inspired me to break it down further with different visualizations.
TVPC Music
June 2016

An interactive website made for the electronic musician, TVPC. Used D3 to graph his soundcloud statistics.
GemTD Maze Runner with Dijkstra
January 2014
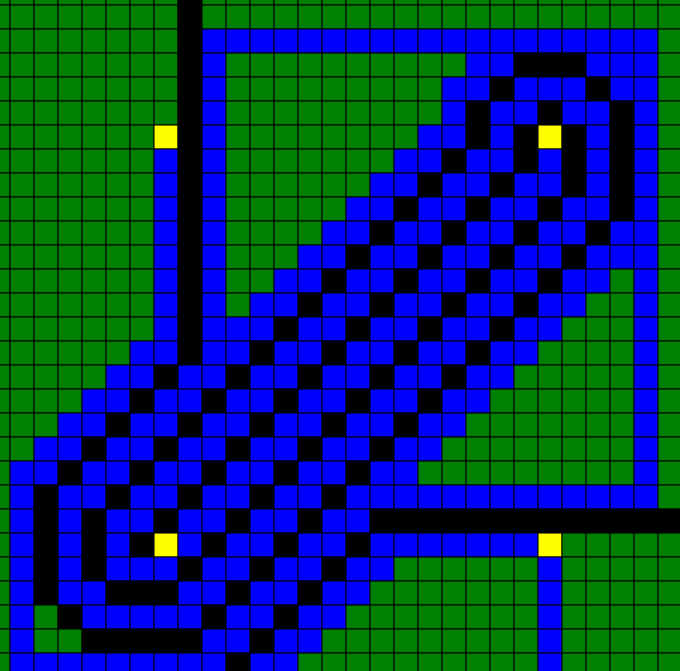
The maze layout is in the classic Gem TD layout from WC3. How many times can you force the unit to run through your maze?